

Hello hodlers and traders, in this detailed article we will go through in complete guide how you can begin trading crypto cryptocurrency as an absolute beginner, be sure to sit back, get your notebooks, jotters and pens and lets begin
Chapter 1 – The Basics
Contents
- What is trading?
- What is investing?
- Trading vs. investing what’s the difference?
- What is fundamental analysis (FA)?
- What is technical analysis (TA)?
- Fundamental analysis vs. technical analysis which is better?
- What drives the financial markets?
- What is a market trend?
- What is a market cycle?
What is trading?
Trading is a fundamental economic concept that involves buying and selling assets. These can be goods and services, where the buyer pays the compensation to the seller. In other cases, the transaction can involve the exchange of goods and services between the trading parties.
In the context of the financial markets, the assets being traded are called financial instruments. These can be stocks, bonds, currency pairs on the Forex market, options, futures, margin products, cryptocurrency, and many others. If these terms are new to you, dont worry well explain them all later in this article.
The term trading is commonly used to refer to short-term trading, where traders actively enter and exit positions over relatively short time frames. However, this is a slightly misleading assumption. In fact, trading may refer to a wide range of different strategies, such as day trading, swing trading, trend trading, and many others. But don’t worry, we will go through each of them in more detail later.
What is investing?

Investing is allocating resources (such as capital) with the expectation of generating a profit. This can include using money to fund and kickstart a business or buying land with the goal of reselling it later at a higher price. In the financial markets, this typically involves investing in financial instruments with the hopes of selling them later at a higher price.
The expectation of a return is core to the concept of investment (this is also known as ROI). As opposed to trading, investing typically takes a longer-term approach to wealth accrual. The goal of an investor is to build wealth over a long period of time (years, or even decades). There are plenty of ways to do that, but investors will typically use fundamental factors to find potentially good investment opportunities.
Due to the long-term nature of their approach, investors usually dont concern themselves with short-term price fluctuations. As such, they will typically stay relatively passive, without worrying too much about short-term losses.
Trading vs. investing whats the difference?
Both traders and investors seek to generate profits in the financial markets. Their methods to achieve this goal, however, are quite different.
Generally, investors seek to generate a return over a longer period of time think years or even decades. Since investors have a larger time horizon, their targeted returns for each investment tend to be larger as well.
Traders, on the other hand, try to take advantage of the market volatility. They enter and exit positions more frequently, and may seek smaller returns with each trade (since theyre often entering multiple trades).
Which one is better? Which one is more suitable for you? That’s for you to decide. You can start educating yourself about the markets, and then learn by doing. Over time, you’ll be able to determine which one suits better your financial goals, personality, and trading profile.
What is fundamental analysis (FA)?
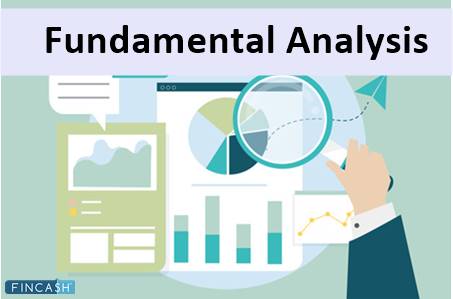
Fundamental analysis is a method for assessing a financial assets valuation. A fundamental analyst studies both economic and financial factors to determine if the value of an asset is fair. These can include macroeconomic circumstances like the state of the wider economy, industry conditions, or the business connected to the asset (if theres one). And these are often tracked through macroeconomics leading and lagging indicators.
Once the fundamental analysis is complete, analysts aim to determine whether the asset is undervalued or overvalued. Investors can use this conclusion when making their investment decisions.
In the case of cryptocurrencies, fundamental analysis may also include an emerging field of data science that concerns itself with public blockchain data called on-chain metrics. These metrics can include the network hash rate, the top holders, the number of addresses, analysis of transactions, and many more. Using the abundance of available data on public blockchains, analysts can create complex technical indicators that measure certain aspects of the overall health of the network.
While fundamental analysis is widely used in the stock market or Forex, its less suitable for cryptocurrencies in their current state. This asset class is so new that there simply isnt a standardized, comprehensive framework for determining market valuations. Whats more, much of the market is driven by speculation and narratives. As such, fundamental factors will typically have negligible effects on the price of a cryptocurrency. However, more accurate ways to think about cryptoasset valuation may be developed once the market matures.
What is technical analysis (TA)?
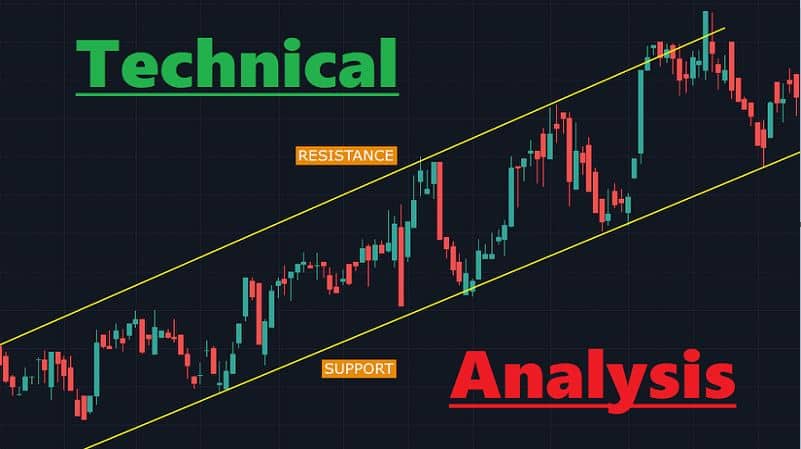
Technical analysts work with a different approach. The core idea behind technical analysis is that historical price action may indicate how the market is likely to behave in the future.
Technical analysts don’t try to find out the intrinsic value of an asset. Instead, they look at the historical trading activity and try to identify opportunities based on that. This can include analysis of price action and volume, chart patterns, the use of technical indicators, and many other charting tools. The goal of this analysis is to evaluate a given markets strength or weakness.
With that said, technical analysis isn’t only a tool for predicting the probabilities of future price movements. It can also be a useful framework for risk management. Since technical analysis provides a model for analyzing market structure, it makes managing trades more defined and measurable. In this context, measuring risk is the first step to managing it. This is why some technical analysts may not be considered strictly traders. They may use technical analysis purely as a framework for risk management.
The practice of technical analysis can be applied to any financial market, and it is widely used among cryptocurrency traders. But does technical analysis work? Well, as we’ve mentioned earlier, the valuation of the cryptocurrency markets is largely driven by speculation. This makes them an ideal playing field for technical analysts, as they can thrive by only considering technical factors.
Fundamental analysis vs. technical analysis which is better?
That entirely depends on your trading strategy. Actually, why not use both? Most market analysis methods work best when they’re combined with other methods or indicators. This way, there’s a bigger chance of finding more reliable investment opportunities. Combining different trading strategies can also help eliminate biases from your decision-making process.
This concept is sometimes referred to as confluence. Confluence traders combine multiple strategies into one that harnesses benefits from all of them. The idea is that the trading opportunities presented by the combined strategies may be stronger than the ones provided by only one strategy.
What drives the financial markets?
The price of an asset is simply determined by the balance of supply and demand. In other words, it is decided by the buyers and sellers. Where supply meets demand, theres a market. But what else can drive the value of a financial asset?
As we’ve discussed earlier, there can be fundamental factors, such as the state of the economy. In addition, there can be technical factors like the market capitalization of a cryptocurrency. Also, there may be other factors to consider, such as market sentiment or recent news.
However, these are just few factors to consider. What really determines the price of an asset in a given moment is simply the balance of supply and demand.
What is a market trend?
A market trend is the overall direction where the price of an asset is going. In technical analysis, market trends are typically identified using price action, trend lines, or even key moving averages.
Generally, there are two main types of market trends: bull and bear market. A bull market consists of a sustained uptrend, where prices are continually going up. A bear market consists of a sustained downtrend, where prices are continually going down. In addition, we can also identify consolidating, or sideways markets, where there isnt a clear directional trend.

Bitcoin has been in a bull market throughout all its existence.
It’s worth noting that a market trend doesn’t mean that the price is always going in the direction of the trend. A prolonged bull market will have smaller bear trends contained with it, and vice versa. This is simply just the nature of market trends. Its a matter of perspective as it all depends on the time frame you are looking at. Market trends on higher time frames will always have more significance than market trends on lower time frames.
A peculiar thing about market trends is that they can only be determined with absolute certainty in hindsight. You may have heard about the concept of hindsight bias, which refers to the tendency of people to convince themselves that they accurately predicted an event before it happened. As you’d imagine, hindsight bias can have a significant impact on the process of identifying market trends and making trading decisions.
What is a market cycle?
You may have heard the phrase that the market moves in cycles. A cycle is a pattern or trend that emerges at different times. Typically, market cycles on higher time frames are more reliable than market cycles on lower time frames. Even so, you can eventually find small market cycles on an hourly chart just as you may do when looking at decades of data.
Markets are cyclical in nature. Cycles can result in certain asset classes outperforming others. In other segments of the same market cycle, those same asset classes may underperform other types of assets due to the different market conditions.
Its worth noting that its almost impossible to determine in any given moment where we currently are in a market cycle. This analysis can be done with high accuracy only after that part of the cycle has concluded. Market cycles also rarely have concrete beginning and endpoints. As it turns out, being in the present moment is an exceptionally biased viewpoint in the financial markets.
Chapter 2 Financial Markets and Trading Instruments
Contents
- What is a financial instrument?
- What is the spot market?
- What is margin trading?
- What is the derivatives market?
- What are forward and futures contracts?
- What are perpetual futures contracts?
- What are options contracts?
- What is the foreign exchange (Forex) market?
- What are leveraged tokens?
What is a financial instrument?
In simple terms, a financial instrument is a tradable asset. Examples include cash, precious metals (like gold or silver), a document that confirms ownership of something (like a business or a resource), a right to deliver or receive cash, and many others. Financial instruments can be really complex, but the basic idea is that whatever they are or whatever they represent, they can be traded.
Financial instruments have various types based on different classification methods. One of the classifications is based on whether they are cash instruments or derivative instruments. As the name would suggest, derivative instruments derive their value from something else (like a cryptocurrency). Financial instruments may also be classified as debt-based or equity-based.
But where do cryptocurrencies fall? We could think of them in multiple ways, and they could fit into more than one category. The simplest classification is that they are digital assets. However, the potential of cryptocurrencies lies in building an entirely new financial and economic system.
In this sense, cryptocurrencies form a completely new category of digital assets. Whats more, as the ecosystem evolves, many new categories may be established that wouldnt otherwise be possible. Early examples of this can already be seen in the Decentralized Finance (DeFi) space.
What is the spot market?
The spot market is where financial instruments are traded for whats called immediate delivery. Delivery, in this context, simply means exchanging the financial instrument for cash. This may seem like an unnecessary distinction, but some markets arent settled in cash instantly. For example, when were talking about the futures markets, the assets are delivered at a later date (when the futures contract expires).
In simple terms, you could think of a spot market as the place where trades are made on the spot. Since the trades are settled immediately, the current market price of an asset is often referred to as the spot price.
So, what does this mean in the context of cryptocurrency markets? What can you do on the spot market? You can exchange coins with each other. So, if you want to exchange your BNB to BUSD, you go to the BNB/BUSD spot market, and voil! In the same way, if you’d like to exchange your BNB to BTC, you’d go to the BNB/BTC spot market. Once your orders are filled, your coins will be swapped instantly. This is one of the easiest ways of trading cryptocurrencies.
What is margin trading?
Margin trading is a method of trading using borrowed funds from a third party. In effect, trading on margin amplifies results both to the upside and the downside. A margin account gives traders more access to capital and eliminates some counterparty risk. How so? Well, traders can trade the same position size but keep less capital on the cryptocurrency exchange.
When it comes to margin trading, you’ll often hear the terms margin and leverage. Margin refers to the amount of capital you commit (i.e., put up from your own pocket). Leverage means the amount that you amplify your margin with. So, if you use 2x leverage, it means that you open a position thats double the amount of your margin. If you use 4x leverage, you open a position thats four times the value of your margin, and so on.
However, be aware of liquidation. The higher leverage you use, the closer the liquidation price is to your entry. If you get liquidated, youll risk losing your entire margin. So, be very aware of the high risks of trading on margin before getting started. The Binance Margin Trading Guide is an essential resource before you get started.
Margin trading is widely used in stock, commodity, and Forex trading, as well as the Bitcoin and cryptocurrency markets. In a more traditional setting, the funds borrowed are provided by an investment broker. When it comes to cryptocurrencies, the funds are typically lent by the exchange in return for a funding fee. In some other cases, however, the borrowed funds may come directly from other traders on the platform. This will usually incur a variable interest rate (funding fee), as the rate is determined by an open marketplace.
What is the derivatives market?
Derivatives are financial assets that base their value on something else. This can be an underlying asset or basket of assets. The most common types are stocks, bonds, commodities, market indexes, or cryptocurrencies.
The derivative product itself is essentially a contract between multiple parties. It gets its price from the underlying asset thats used as the benchmark. Whatever asset is used as this reference point, the core concept is that the derivative product derives its value from it. Some common examples of derivatives products are futures contracts, options contracts, and swaps.
According to some estimates, the derivatives market is one of the biggest markets out there. How so? Well, derivatives can exist for virtually any financial product even derivatives themselves. Yes, derivatives can be created from derivatives. And then, derivatives can be created from those derivatives, and so on. Does this sound like a shaky house of cards ready to come crashing down? Well, this may not be so far from the truth. Some argue that the derivatives market played a major part in the 2008 Financial Crisis.
What are forward and futures contracts?
A futures contract is a type of derivatives product that allows traders to speculate on the future price of an asset. It involves an agreement between parties to settle the transaction at a later date called the expiry date. As weve discussed with derivatives, the underlying asset for a contract like this can be any asset. Common examples include cryptocurrency, commodities, stocks, and bonds.
The expiration date of a futures contract is the last day that trading activity is ongoing for that specific contract. At the end of that day, the contract expires to the last traded price. The settlement of the contract is determined beforehand, and it can be either cash-settled or physically-delivered.
When its delivered physically, the underlying asset of the contract is directly exchanged. For example, barrels of oil are delivered. When its settled in cash, the underlying asset isnt exchanged directly, only the value that it represents (in the form of cash or cryptocurrency).
What are perpetual futures contracts?
Futures products are a great way for traders to speculate on the price of an asset. However, what if they want to remain in their position even after the expiry date?
Enter perpetual futures contracts. The main difference between them and a regular futures contract is that they never expire. This way, traders can speculate on the price of the underlying asset without having to worry about expiration.
However, this presents a problem of its own. What if the price of the perpetual futures contract gets really far from the price of the underlying asset? Since theres no expiry date, the perpetual futures market could have a significant, continual disparity with the spot market.
This is why perpetual futures contracts implement a funding fee thats paid between traders. Lets imagine that the perpetual futures market is trading higher than the spot market. In this case, the funding rate will be positive, meaning that long positions (buyers) pay the funding fees to short positions (sellers). This encourages buyers to sell, which then causes the price of the contract to drop, moving it closer to the spot price. Conversely, if the perpetual futures market is trading lower than the spot market, the funding rate will be negative. This time, shorts pay longs to incentivize pushing up the price of the contract.
To summarize, if funding is positive, longs pay shorts. If funding is negative, shorts pay longs.
What are options contracts?
An options contract is a type of derivatives product that gives traders the right, but not the obligation, to buy or sell an asset in the future at a specific price. The main difference between a futures contract and an options contract is that traders are not obligated to settle options contracts.
When traders buy an options contract, they speculate on the price going in a direction.
There are two types of options contracts: call options and put options. A call option bets on the price going up, while a put option bets on the price going down.
As with other derivatives products, options contracts can be based on a wide variety of financial assets: market indexes, commodities, stocks, cryptocurrencies, and so on.
Options contracts can enable highly complex trading strategies and risk management methods, such as hedging. In the context of cryptocurrencies, options might be the most useful for miners who want to hedge their large cryptocurrency holdings. This way, theyre better protected against events that could have a detrimental impact on their funds.
What is the foreign exchange (Forex) market?
The foreign exchange (Forex, FX) market is where traders can exchange one countrys currency into another. In essence, the Forex market is what determines the exchange rates for currencies around the world.
We may often think of currencies as safe haven assets. Even the term stablecoin should imply, in theory, that the asset is somehow safe from volatility. However, while this is true to some extent, currencies can also experience significant market fluctuations. How come? Well, the value of currencies is also determined by supply and demand. In addition, they may also be influenced by inflation or other market forces related to global trade and investment, and geopolitical factors.
How does the Forex market work? Well, currency pairs may be traded by investment banks, central banks, commercial companies, investment firms, hedge funds, and retail Forex traders. The Forex market also enables global currency conversions for international trade settlements.
Forex traders will typically use day trading strategies, such as scalping with leverage, to amplify their returns. We’ll cover how exactly that works later in this article.
The Forex market is one of the major building blocks of the modern global economy as we know it. In fact, the Forex market is the largest and most liquid financial market in the world.
What are leveraged tokens?
Leveraged tokens are tradable assets that can give you leveraged exposure to the price of a cryptocurrency without the usual requirements of managing a leveraged position. This means you dont have to worry about margin, collateral, funding, and liquidation.
Leveraged tokens are an innovative financial product that only exist thanks to the power of blockchain. Leveraged tokens were initially introduced by derivatives exchange FTX, but since then have seen various alternative implementations. The main idea behind them, however, is still the same tokenizing open leveraged positions. What does this mean?
Leveraged tokens represent open perpetual futures positions in a tokenized form. Remember when we discussed how derivatives can be created from derivatives? Leveraged tokens are a prime example since they derive their value from futures positions, which are also derivatives.
Chapter 3 Trading and Investment Strategies
Contents
- What is a trading strategy?
- What is portfolio management?
- What is risk management?
- What is day trading?
- What is swing trading?
- What is position trading?
- What is scalping?
- What is asset allocation and diversification?
- What is the Dow Theory?
- What is the Elliott Wave Theory?
- What is the Wyckoff Method?
- What is buy and hold?
- What is index investing?
- What is paper trading?
What is a trading strategy?
A trading strategy is simply a plan you follow when executing trades. There’s no single correct approach to trading, so each strategy will largely depend on the traders profile and preferences.
Regardless of your approach to trading, establishing a plan is crucial it outlines clear goals and can prevent you from going off course due to emotion. Typically, youll want to decide what youre trading, how youre going to trade it, and the points at which youll enter and exit.
In the following chapter, well get into a few examples of popular trading strategies.
What is portfolio management?
Portfolio management concerns itself with the creation and handling of a collection of investments. The portfolio itself is a grouping of assets it could contain anything from Beanie Babies to real estate. If youre exclusively trading cryptocurrencies, then it will probably be made up of some combination of Bitcoin and other digital coins and tokens.
Your first step is to consider your expectations for the portfolio. Are you looking for a basket of investments that will remain relatively protected from volatility, or something riskier that might bring higher returns in the short term?
Putting some thought into how you want to manage your portfolio is highly beneficial. Some might prefer a passive strategy one where you leave your investments alone after you set them up. Others could take an active approach, where they continuously buy and sell assets to make profits.
What is risk management?

Managing risk is vital to success in trading. This begins with the identification of the types of risk you may encounter:
- Market risk: the potential losses you could experience if the asset loses value.
- Liquidity risk: the potential losses arising from illiquid markets, where you cannot easily find buyers for your assets.
- Operational risk: the potential losses that stem from operational failures. These may be due to human error, hardware/software failure, or intentional fraudulent conduct by employees.
- Systemic risk: the potential losses caused by the failure of players in the industry you operate in, which impacts all businesses in that sector. As was the case in 2008, the collapse of the Lehman Brothers had a cascading effect on worldwide financial systems.
As you can see, risk identification begins with the assets in your portfolio, but it should take into account both internal and external factors to be effective. Next, youll want to assess these risks. How often are you likely to encounter them? How severe are they?
By weighing up the risks and figuring out their possible impact on your portfolio, you can rank them and develop appropriate strategies and responses. Systemic risk, for example, can be mitigated with diversification into different investments, and market risk can be lessened with the use of stop-losses.
What is day trading?
Day trading is a strategy that involves entering and exiting positions within the same day. The term comes from legacy markets, referencing the fact that theyre only open for set periods during the day. Outside of those periods, day traders are not expected to keep any of their positions open.
Cryptocurrency markets, as you probably know, are not subject to opening or closing times. You can trade around the clock every day of the year. Still, day trading in the context of cryptocurrency tends to refer to a trading style where the trader enters and exits positions within 24 hours.
In day trading, youll often rely on technical analysis to determine which assets to trade. Because profits in such a short period can be minimal, you may opt to trade across a wide range of assets to try and maximize your returns. That said, some might exclusively trade the same pair for years.
This style is obviously a very active trading strategy. It can be highly profitable, but it carries with it a significant amount of risk. As such, day trading is generally better suited to experienced traders.
What is swing trading?
In swing trading, youre still trying to profit off market trends, but the time horizon is longer positions are typically held anywhere from a couple of days to a couple of months.
Often, your goal will be to identify an asset that looks undervalued and is likely to increase in value. You would purchase this asset, then sell it when the price rises to generate a profit. Or you can try to find overvalued assets that are likely to decrease in value. Then, you could sell some of them at a high price, hoping to buy them back for a lower price.
As with day trading, many swing traders use technical analysis. However, because their strategy plays out across a longer period, fundamental analysis may also be a valuable tool.
Swing trading tends to be a more beginner-friendly strategy. Mainly because it doesnt come with the stress of fast-paced day trading. Where the latter is characterized by rapid decision-making and a lot of screen time, swing trading allows you to take your time.
What is position trading?
Position (or trend) trading is a long-term strategy. Traders purchase assets to hold for extended periods (generally measured in months). Their goal is to make a profit by selling those assets at a higher price in the future.
What distinguishes position trades from long-term swing trades is the rationale behind placing the trade. Position traders are concerned with trends that can be observed over extended periods theyll try to profit from the overall market direction. Swing traders, on the other hand, typically seek to predict swings in the market that dont necessarily correlate with the broader trend.
Its not uncommon to see position traders favor fundamental analysis, purely because their time preference allows them to watch fundamental events materialize. Thats not to say technical analysis isnt used. While position traders work on the assumption that the trend will continue, the use of technical indicators can alert them to the possibility of a trend reversal.
Like swing trading, position trading is an ideal strategy for beginners. Once again, the long time horizon gives them ample opportunity to deliberate on their decisions.
What is scalping?
Of all of the strategies discussed, scalping takes place across the smallest time frames. Scalpers attempt to game small fluctuations in price, often entering and exiting positions within minutes (or even seconds). In most cases, theyll use technical analysis to try and predict price movements and exploit bid-ask spread and other inefficiencies to make a profit. Due to the short time frames, scalping trades often give a small percentage of profits usually lower than 1%. But scalping is a numbers game, so repeated small profits can add up over time.
Scalping is by no means a beginners strategy. An in-depth understanding of the markets, the platforms youre trading on, and technical analysis are vital to success. That said, for traders that know what theyre doing, identifying the right patterns and taking advantage of short-term fluctuations can be highly profitable.
What is asset allocation and diversification?
Asset allocation and diversification are terms that tend to be used interchangeably. You might know the principles from the saying dont keep all your eggs in one basket. Keeping all of your eggs in one basket creates a central point of failure the same holds true for your wealth. Investing your life savings into one asset exposes you to the same kind of risk. If the asset in question was the stock of a particular company and that company then imploded, youd lose your money in one swift movement.
This isnt just true of single assets, but of asset classes. In the case of a financial crisis, youd expect all of the stock you hold to lose value. This is because theyre heavily correlated, meaning that all tend to follow the same trend.
Good diversification isnt simply filling your portfolio with hundreds of different digital currencies. Consider an event where the world governments ban cryptocurrencies, or quantum computers break the public-key cryptography schemes we use in them. Either of these occurrences would have a profound impact on all digital assets. Like stocks, they make up a single asset class.
Ideally, you want to spread your wealth across multiple classes. That way, if one is performing poorly, it has no knock-on effect on the rest of your portfolio. Nobel Prize winner Harry Markowitz introduced this idea with the Modern Portfolio Theory (MPT). In essence, the theory makes the case for reducing the volatility and risk associated with investments in a portfolio by combining uncorrelated assets.
What is the Dow Theory?

The Dow Theory is a financial framework modeled on the ideas of Charles Dow. Dow founded the Wall Street Journal and helped create the first US stock indices, known as the Dow Jones Transportation Average (DJTA) and Dow Jones Industrial Average (DJIA).
Though the Dow Theory was never formalized by Dow himself, it can be seen as an aggregation of the market principles presented in his writings. Here are some of the key takeaways:
- Everything is priced in Dow was a proponent of the efficient market hypothesis (EMH), the idea that markets reflect all of the available information on the price of their assets.
- Market trends Dow is often credited with the very notion of market trends as we know them today, distinguishing between primary, secondary, and tertiary trends.
- The phases of a primary trend in primary trends, Dow identifies three phases: accumulation, public participation, and excess distribution.
- Cross-index correlation Dow believed that a trend in one index couldnt be confirmed unless it was observable in another index.
- The importance of volume a trend must also be confirmed by high trading volume.
- Trends are valid until reversal if a trend is confirmed, it continues until a definite reversal occurs.
Its worth remembering that this isnt an exact science its a theory, and it might not hold true. Still, its a theory that remains hugely influential, and many traders and investors consider it an integral part of their methodology.
What is the Elliott Wave Theory?
Elliott Wave Theory (EWT) is a principle positing that market movements follow the psychology of market participants. While its used in many technical analysis strategies, it isnt an indicator or specific trading technique. Rather, its a way to analyze the market structure.
The Elliott Wave pattern can typically be identified in a series of eight waves, each of which is either aMotive Waveor aCorrective Wave. You would have five Motive Waves that follow the general trend, and three Corrective Waves that move against it.

An Elliot Wave Cycle, with Motive Waves (blue) and Corrective Waves (yellow).
The patterns also have a fractal property, meaning that you could zoom into a single wave to see another Elliot Wave pattern. Alternatively, you could zoom out to find that the pattern youve been examining is also a single wave of a bigger Elliot Wave cycle.
Elliott Wave Theory is met with mixed reviews. Some argue that the methodology is too subjective because traders can identify waves in various ways without violating the rules. Like the Dow Theory, the Elliott Wave Theory isnt foolproof, so it should not be viewed as an exact science. That said, many traders have had great success by combining EWT with other technical analysis tools.
What is the Wyckoff Method?
The Wyckoff Method is an extensive trading and investing strategy that was developed by Charles Wyckoff in the 1930s. His work is widely regarded as a cornerstone of modern technical analysis techniques across numerous financial markets.
Wyckoff proposed three fundamental laws the law of supply and demand, the Law of Cause and Effect, and the Law of Effort vs. Result. He also formulated the Composite Man theory, which has significant overlap with Charles Dows breakdown of primary trends. His work in this area is particularly valuable to cryptocurrency traders.
On the practical side of things, the Wyckoff Method itself is a five-step approach to trading. It can be broken down as follows:
- Determine the trend: whats it like now, and where is it headed?
- Identify strong assets: are they moving with the market or in the opposite direction?
- Find assets with sufficient Cause: is there enough reason to enter the position? Do the risks make the potential reward worth it?
- Assess the likelihood of the movement: do things like Wyckoffs Buying and Selling Tests point to a possible movement? What do the price and volume suggest? Is this asset ready to move?
- Time your entry: how are the assets looking in relation to the general market? When is the best time to enter a position?
The Wyckoff Method was introduced almost a century ago, but it remains highly relevant to this day. The scope of Wyckoffs research was vast, and therefore the above should only be seen as a very condensed overview. Its recommended that you explore his work in more depth, as it provides indispensable technical analysis knowledge. Start with The Wyckoff Method Explained.
What is buy and hold?
The buy and hold strategy, perhaps unsurprisingly, involves buying and holding an asset. Its a long-term passive play where investors purchase the asset and then leave it alone, regardless of market conditions. A good example of this in the crypto space is HODLing, which typically refers to investors that prefer to buy and hold for years instead of actively trading.
This can be an advantageous approach for those that prefer hands-off investing as they dont need to worry about short-term fluctuations or capital gains taxes. On the other hand, it requires patience on the investors part and assumes that the asset wont end up totally worthless.
What is index investing?
Index investing could be regarded as a form of buy and hold. As the name implies, the investor seeks to profit from the movement of assets within a specific index. They could do so by purchasing the assets on their own, or by investing in an index fund.
Again, this is a passive strategy. Individuals can also benefit from diversification across multiple assets, without the stress of active trading.
What is paper trading?
Paper trading could be any kind of strategy but the trader is only pretending to buy and sell assets. This is something you might consider as a beginner (or even as an experienced trader) to test your skills without putting your money at stake.
You may think, for instance, that youve discovered a good strategy for timing Bitcoin dips, and want to try profiting from those drops before they occur. But before you risk all of your funds, you might opt to paper trade. This can be as simple as writing down the price at the time you open your short, and again when you close it. You could equally use some kind of simulator that mimics popular trading interfaces.
The main benefit of paper trading is that you can test out strategies without losing your money if things go wrong. You can get an idea of how your moves would have performed with zero risk. Of course, you need to be aware that paper trading only gives you a limited understanding of a real environment. Its hard to replicate the real emotions you experience when your money is involved. Paper trading without a real-life simulator may also give you a false sense of associated costs and fees, unless you factor them in for specific platforms.
Binance offers a couple of options for paper trading. For instance, the Binance Futures Testnet provides a full-fledged interface. If youre building trading bots or programs yourself, then the spot exchange testnet can be accessed via API.
Chapter 4 – Technical Analysis Basics
Contents
- What is a long position?
- What is shorting?
- What is the order book?
- What is the order book depth?
- What is a market order?
- What is slippage in trading?
- What is a limit order?
- What is a stop-loss order?
- What are makers and takers?
- What is the bid-ask spread?
- What is a candlestick chart?
- What is a candlestick chart pattern?
- What is a trend line?
- What are support and resistance?
What is a long position?
A long position (or simply long) means buying an asset with the expectation that its value will rise. Long positions are often used in the context of derivatives products or Forex, but they apply to basically any asset class or market type. Buying an asset on the spot market in the hopes that its price will increase also constitutes a long position.
Going long on a financial product is the most common way of investing, especially for those just starting out. Long-term trading strategies like buy and hold are based on the assumption that the underlying asset will increase in value. In this sense, buy and hold is simply going long for an extended period of time.
However, being long doesnt necessarily mean that the trader expects to gain from an upward movement in price. Take leveraged tokens, for example. BTCDOWN is inversely correlated to the price of Bitcoin. If the price of Bitcoin goes up, the price of BTCDOWN goes down. If the price of Bitcoin goes down, the price of BTCDOWN goes up. In this sense, entering a long position in BTCDOWN equals a downward movement in the price of Bitcoin.
What is shorting?
A short position (or short) means selling an asset with the intention of rebuying it later at a lower price. Shorting is closely related to margin trading, as it may happen with borrowed assets. However, its also widely used in the derivatives market, and can be done with a simple spot position. So, how does shorting work?
When it comes to shorting on the spot markets, its quite simple. Lets say you already have Bitcoin and you expect the price to go down. You sell your BTC for USD, as you plan to rebuy it later at a lower price. In this case, youre essentially entering a short position on Bitcoin since youre selling high to rebuy lower. Easy enough. But what about shorting with borrowed funds? Lets see how that works.
You borrow an asset that you think will decrease in value for example, a stock or a cryptocurrency. You immediately sell it. If the trade goes your way and the asset price decreases, you buy back the same amount of the asset that youve borrowed. You repay the assets that youve borrowed (along with interest) and profit from the difference between the price you initially sold and the price you rebought.
So, what does shorting Bitcoin look like with borrowed funds? Lets look at an example. We put up the required collateral to borrow 1 BTC, then immediately sell it for $10,000. Now weve got $10,000. Lets say the price goes down to $8,000. We buy 1 BTC and repay our debt of 1 BTC along with interest. Since we initially sold Bitcoin for $10,000 and now rebought at $8,000, our profit is $2,000 (minus the interest payment and trading fees).
What is the order book?
The order book is a collection of the currently open orders for an asset, organized by price. When you post an order that isnt filled immediately, it gets added to the order book. It will sit there until it gets filled by another order or canceled.
Order books will differ with each platform, but generally, theyll contain roughly the same information. Youll see the number of orders at specific price levels.
When it comes to crypto exchanges and online trading, orders in the order book are matched by a system called the matching engine. This system is what ensures that trades are executed you could think of it as the brain of the exchange. This system, along with the order book, is core to the concept of electronic exchange.
What is the order book depth?
The order book depth (or market depth) refers to a visualization of the currently open orders in the order book. It usually puts buy orders on one side, and sell orders on the other and displays them cumulatively on a chart.

Order book depth of the BTC/USDT market pair on Binance.
In more general terms, the depth of the order book may also refer to the amount of liquidity that the order book can absorb. The deeper the market is, the more liquidity there is in the order book. In this sense, a market with more liquidity can absorb larger orders without a considerable effect on the price. However, if the market is illiquid, large orders may have a significant impact on the price.
What is a market order?
A market order is an order to buy or sell at the best currently available market price. Its basically the fastest way to get in or out of a market.
When youre setting a market order, youre basically saying: Id like to execute this order right now at the best price I can get.
Your market order will keep filling orders from the order book until the entire order is fully filled. This is why large traders (or whales) can have a significant impact on the price when they use market orders. A large market order can effectively siphon liquidity from the order book. How so? Lets go through it when discussing slippage.
What is slippage in trading?
There is something you need to be aware of when it comes to market orders slippage. When we say that market orders fill at the best available price, that means that they keep filling orders from the order book until the entire order is executed.
However, what if there isnt enough liquidity around the desired price to fill a large market order? There could be a big difference between the price that you expect your order to fill and the price that it fills at. This difference is called slippage.
Lets say youd like to open a long position worth 10 BTC in an altcoin. However, this altcoin has a relatively small market cap and is being traded on a low-liquidity market. If you use a market order, it will keep filling orders from the order book until the entire 10 BTC order is filled. On a liquid market, you would be able to fill your 10 BTC order without impacting the price significantly. But, in this case, the lack of liquidity means that there may not be enough sell orders in the order book for the current price range.
So, by the time the entire 10 BTC order is filled, you may find out that the average price paid was much higher than expected. In other words, the lack of sell orders caused your market order to move up the order book, matching orders that were significantly more expensive than the initial price.
Be aware of slippage when trading altcoins, as some trading pairs may not have enough liquidity to fill your market orders.
What is a limit order?
A limit order is an order to buy or sell an asset at a specific price or better. This price is called the limit price. Limit buy orders will execute at the limit price or lower, while limit sell orders will execute at the limit price or higher.
When youre setting a limit order, youre basically saying: Id like to execute this order at this specific price or better, but never worse.
Using a limit order allows you to have more control over your entry or exit for a given market. In fact, it guarantees that your order will never fill at a worse price than your desired price. However, that also comes with a downside. The market may never reach your price, leaving your order unfilled. In many cases, this can mean losing out on a potential trade opportunity.
Deciding when to use a limit order or market order can vary with each trader. Some traders may use only one or the other, while other traders will use both depending on the circumstances. The important thing is to understand how they work so you can decide for yourself.
What is a stop-loss order?
Now that we know what market and limit orders are, lets talk about stop-loss orders. A stop-loss order is a type of limit or market order thats only activated when a certain price is reached. This price is called the stop price.
The purpose of a stop-loss order is mainly to limit losses. Every trade needs to have an invalidation point, which is a price level that you should define in advance. This is the level where you say that your initial idea was wrong, meaning that you should exit the market to prevent further losses. So, the invalidation point is where you would typically put your stop-loss order.
How does a stop-loss order work? As weve mentioned, the stop-loss can be both a limit or a market order. This is why these variants may also be referred to as stop-limit and stop-market orders. The key thing to understand is that the stop-loss only activates when a certain price is reached (the stop price). When the stop price is reached, it activates either a market or a limit order. You basically set the stop price as the trigger for your market or limit order.
However, there is one thing you should keep in mind. We know that limit orders only fill at the limit price or better, but never worse. If youre using a stop-limit order as your stop-loss and the market crashes violently, it may instantly move away from your limit price, leaving your order unfilled. In other words, the stop price would trigger your stop-limit order, but the limit order would remain unfilled due to the sharp price drop. This is why stop-market orders are considered safer than stop-limit orders. They ensure that even under extreme market conditions, youll be guaranteed to exit the market once your invalidation point is reached.
What are makers and takers?
You become a maker when you place an order that doesnt immediately get filled but gets added to the order book. Since your order is adding liquidity to the order book, youre a maker of liquidity.
Limit orders will typically execute as maker orders, but not in all cases. For example, lets say you place a limit buy order with a limit price thats considerably higher than the current market price. Since youre saying your order can execute at the limit price or better, your order will execute against the market price (as its lower than your limit price).
You become a taker when you place an order that gets immediately filled. Your order doesnt get added to the order book, but is immediately matched with an existing order in the order book. Since youre taking liquidity from the order book, youre a taker. Market orders will always be taker orders, as youre executing your order at the best currently available market price.
Some exchanges adopt a multi-tier fee model to incentivize traders to provide liquidity. After all, its in their interest to attract high volume traders to their exchange liquidity attracts more liquidity. In such systems, makers tend to pay lower fees than takers, since theyre the ones adding liquidity to the exchange. In some cases, they may even offer fee rebates to makers. You can check your current fee tier on Binance on this page.
What is the bid-ask spread?
The bid-ask spread is the difference between the highest buy order (bid) and the lowest sell order (ask) for a given market. Its essentially the gap between the highest price where a seller is willing to sell and the lowest price where a buyer is willing to buy.
The bid-ask spread is a way to measure a markets liquidity. The smaller the bid-ask spread is, the more liquid the market is. The bid-ask spread can also be considered as a measure of supply and demand for a given asset. In this sense, the supply is represented by the ask side while the demand by the bid side.
When youre placing a market buy order, it will fill at the lowest available ask price. Conversely, when you place a market sell order, it will fill at the highest available bid.
What is a candlestick chart?
A candlestick chart is a graphical representation of the price of an asset for a given timeframe. Its made up of candlesticks, each representing the same amount of time. For example, a 1-hour chart shows candlesticks that each represent a period of one hour. A 1-day chart shows candlesticks that each represent a period of one day, and so on.

Daily chart of Bitcoin. Each candlestick represents one day of trading.
A candlestick is made up of four data points: the Open, High, Low, and Close (also referred to as the OHLC values). The Open and Close are the first and last recorded price for the given timeframe, while the Low and High are the lowest and highest recorded price, respectively.
Candlestick charts are one of the most important tools for analyzing financial data. Candlesticks date back to the 17th century Japan but have been refined in the early 20th century by trading pioneers such as Charles Dow
What is a candlestick chart pattern?
Technical analysis is largely based on the assumption that previous price movements may indicate future price action. So, how can candlesticks be useful in this context? The idea is to identify candlestick chart patterns and create trade ideas based on them.
Candlestick charts help traders analyze market structure and determine whether were in a bullish or bearish market environment. They may also be used to identify areas of interest on a chart, like support or resistance levels or potential points of reversal. These are the places on the chart that usually have increased trading activity.
Candlestick patterns are also a great way to manage risk, as they can present trade setups that are defined and exact. How so? Well, candlestick patterns can define clear price targets and invalidation points. This allows traders to come up with very precise and controlled trade setups. As such, candlestick patterns are widely used by Forex and cryptocurrency traders alike.
What is a trend line?
Trend lines are a widely used tool by both traders and technical analysts. They are lines that connect certain data points on a chart. Typically, this data is the price, but not in all cases. Some traders may also draw trend lines on technical indicators and oscillators.
The main idea behind drawing trend lines is to visualize certain aspects of the price action. This way, traders can identify the overall trend and market structure.

The price of Bitcoin touching a trend line multiple times, indicating an uptrend.
Some traders may only use trend lines to get a better understanding of the market structure. Others may use them to create actionable trade ideas based on how the trend lines interact with the price.
Trend lines can be applied to a chart showing virtually any time frame. However, as with any other market analysis tool, trend lines on higher time frames tend to be more reliable than trend lines on lower time frames.
Another aspect to consider here is the strength of a trend line. The conventional definition of a trend line defines that it has to touch the price at least two or three times to become valid. Typically, the more times the price has touched (tested) a trend line, the more reliable it may be considered.
What are support and resistance?
Support and resistance are some of the most basic concepts related to trading and technical analysis.
Support means a level where the price finds a floor. In other words, a support level is an area of significant demand, where buyers step in and push the price up.
Resistance means a level where the price finds a ceiling. A resistance level is an area of significant supply, where sellers step in and push the price down.

Support level (red) is tested and broken, turning into resistance.
Now you know that support and resistance are levels of increased demand and supply, respectively. However, many other factors can be at play when thinking about support and resistance.
Technical indicators, such as trend lines, moving averages, Bollinger Bands, Ichimoku Clouds, and Fibonacci Retracement can also suggest potential support and resistance levels. In fact, even aspects of human psychology are used. This is why traders and investors may incorporate support and resistance very differently in their individual trading strategy.
Chapter 5 Technical Analysis Indicators
Contents
- What is a technical analysis indicator?
- Leading vs. lagging indicators
- What is a momentum indicator?
- What is the trading volume?
- What is the Relative Strength Index (RSI)?
- What is a Moving Average (MA)?
- What is the Moving Average Convergence Divergence (MACD)?
- What is the Fibonacci Retracement tool?
- What is the Stochastic RSI (StochRSI)?
- What are Bollinger Bands (BB)?
- What is the Volume-Weighted Average Price (VWAP)?
- What is the Parabolic SAR?
- What is the Ichimoku Cloud?
What is a technical analysis indicator?
Technical indicators calculate metrics related to a financial instrument. This calculation can be based on price, volume, on-chain data, open interest, social metrics, or even another indicator.
As weve discussed earlier, technical analysts base their methods on the assumption that historical price patterns may dictate future price movements. As such, traders who use technical analysis may use an array of technical indicators to identify potential entry and exit points on a chart.
Technical indicators may be categorized by multiple methods. This can include whether theyre pointing towards future trends (leading indicators), confirming a pattern thats already underway (lagging indicators), or clarify real-time events (coincident indicators).
Some other categorization may concern itself with how these indicators present the information. In this sense, there are overlay indicators that overlay data over price, and there are oscillators that oscillate between a minimum and a maximum value.
There are also types of indicators that aim to measure a specific aspect of the market, such as momentum indicators. As the name would suggest, they aim to measure and display market momentum.
So, which is the best technical analysis indicator out there? There isnt a simple answer to this question. Traders may use many different types of technical indicators, and their choice is largely based on their individual trading strategy. However, to be able to make that choice, they needed to learn about them first and thats what were going to do in this chapter.
Leading vs. lagging indicators
As weve discussed, different indicators will have distinct qualities and should be used for specific purposes. Leading indicators point towards future events. Lagging indicators are used to confirm something that has already happened. So, when should you use them?
Leading indicators are typically useful for short- and mid-term analysis. They are used when analysts anticipate a trend and are looking for statistical tools to back up their hypothesis. Especially when it comes to economics, leading indicators can be particularly useful to predict periods of recession.
When it comes to trading and technical analysis, leading indicators can also be used for their predictive qualities. However, no special indicator can predict the future, so these forecasts should always be taken with a grain of salt.
Lagging indicators are used to confirm events and trends that had already happened, or are already underway. This may seem redundant, but it can be very useful. Lagging indicators can bring certain aspects of the market to the spotlight that otherwise would remain hidden. As such, lagging indicators are typically applied to longer-term chart analysis.
What is a momentum indicator?
Momentum indicators aim to measure and show market momentum. What is market momentum? In simple terms, its the measure of the speed of price changes. Momentum indicators aim to measure the rate at which prices rise or fall. As such, theyre typically used for short-term analysis by traders who are looking to profit from bursts of high volatility.
The goal of a momentum trader is to enter trades when momentum is high, and exit when market momentum starts to fade. Typically, if volatility is low, the price tends to squeeze into a small range. As the tension builds up, the price often makes a big impulse move, eventually breaking out of the range. This is when momentum traders thrive.
After the move has concluded and the traders have exited their position, they move on to another asset with high momentum and try to repeat the same game plan. As such, momentum indicators are widely used by day traders, scalpers, and short-term traders who are looking for quick trading opportunities.
What is the trading volume?
The trading volume may be considered the quintessential indicator. It shows the number of individual units traded for an asset in a given time. It basically shows how much of that asset changed hands during the measured time.
Some consider the trading volume to be the most important technical indicator out there. Volume precedes price is a famous saying in the trading world. It suggests that large trading volume can be a leading indicator before a big price move (regardless of the direction).
By using volume in trading, traders can measure the strength of the underlying trend. If high volatility is accompanied by high trading volume, that may be considered a validation of the move. This makes sense because high trading activity should equal a significant volume since many traders and investors are active at that particular price level. However, if volatility isnt accompanied by high volume, the underlying trend may be considered weak.
Price levels with historically high volume may also give a good potential entry or exit point for traders. Since history tends to repeat itself, these levels may be where increased trading activity is more likely to happen. Ideally, support and resistance levels should also be accompanied by an uptick in volume, confirming the strength of the level.
What is the Relative Strength Index (RSI)?
The Relative Strength Index (RSI) is an indicator that illustrates whether an asset is overbought or oversold. It is a momentum oscillator that shows the rate at which price changes happen. This oscillator varies between 0 and 100, and the data is usually displayed on a line chart.

The RSI indicator applied to a Bitcoin chart.
Whats the idea behind measuring market momentum? Well, if the momentum is increasing while the price is going up, the uptrend may be considered strong. Conversely, if momentum is diminishing in an uptrend, the uptrend may be considered weak. In this case, a reversal may be coming.
Lets see how the traditional interpretation of the RSI works. When the RSI value is under 30, the asset may be considered oversold. In contrast, it may be considered overbought when its above 70.
Still, RSI readings should be taken with a degree of skepticism. The RSI can reach extreme values during extraordinary market conditions and even then, the market trend may still continue for a while.
What is a Moving Average (MA)?
Moving averages smooth out price action and make it easier to spot market trends. As theyre based on previous price data, they lack predictive qualities. As such, moving averages are considered lagging indicators.
Moving averages have various types the two most common one is the simple moving average (SMA or MA) and the exponential moving average (EMA). Whats the difference between them?
The simple moving average is calculated by taking price data from the previous n periods and producing an average. For example, the 10-day SMA takes the average price of the last 10 days and plots the results on a graph.

200-week moving average based on the price of Bitcoin.
The exponential moving average is a bit trickier. It uses a different formula that puts a bigger emphasis on more recent price data. As a result, the EMA reacts more quickly to recent events in price action, while the SMA may take more time to catch up.
As weve mentioned, moving averages are lagging indicators. The longer the period they plot, the greater the lag. As such, a 200-day moving average will react slower to unfolding price action than a 100-day moving average.
What is the Moving Average Convergence Divergence (MACD)?
The MACD is an oscillator that uses two moving averages to show the momentum of a market. As it tracks price action that has already occurred, its a lagging indicator.
The MACD is made up of two lines the MACD line and the signal line. How do you calculate them? Well, you get the MACD line by subtracting the 26 EMA from the 12 EMA. Simple enough. Then, you plot this over the MACD lines 9 EMA the signal line. In addition, many charting tools will also show a histogram that illustrates the distance between the MACD line and the signal line.

The MACD indicator applied to a Bitcoin chart.
Traders may use the MACD by observing the relationship between the MACD line and the signal line. A crossover between the two lines is usually a notable event when it comes to the MACD. If the MACD line crosses above the signal line, that may be interpreted as a bullish signal. In contrast, if the MACD line crosses below the signal, that may be interpreted as a bearish signal.
What is the Fibonacci Retracement tool?
The Fibonacci Retracement (or Fib Retracement) tool is a popular indicator based on a string of numbers called the Fibonacci sequence. These numbers were identified in the 13th century, by an Italian mathematician called Leonardo Fibonacci.
The Fibonacci numbers are now part of many technical analysis indicators, and the Fib Retracement is among the most popular ones. It uses ratios derived from the Fibonacci numbers as percentages. These percentages are then plotted over a chart, and traders can use them to identify potential support and resistance levels.
These Fibonacci ratios are:
- 0%
- 23.6%
- 38.2%
- 61.8%
- 78.6%
- 100%
While 50% is technically not a Fibonacci ratio, many traders also consider it when using the tool. In addition, Fibonacci ratios outside of the 0-100% range may also be used. Some of the most common ones are 161.8%, 261.8%, and 423.6%.

Fibonacci levels on a Bitcoin chart.
So, how can traders use the Fibonacci Retracement levels? The main idea behind plotting percentage ratios on a chart is to find areas of interest. Typically, traders will pick two significant price points on a chart, and pin the 0 and 100 values of the Fib Retracement tool to those points. The range outlined between these points may highlight potential entry and exit points, and help determine stop-loss placement.
What is the Stochastic RSI (StochRSI)?
The Stochastic RSI, or StochRSI, is a derivative of the RSI. Similarly to the RSI, its main goal is to determine whether an asset is overbought or oversold. In contrast to the RSI, however, the StochRSI isnt generated from price data, but RSI values. On most charting tools, the values of the StochRSI will range between 0 and 1 (or 0 and 100).
The StochRSI tends to be the most useful when its near the upper or lower extremes of its range. However, due to its greater speed and higher sensitivity, it may produce a lot of false signals that can be challenging to interpret.
The traditional interpretation of the StochRSI is somewhat similar to that of the RSI. When its over 0.8, the asset may be considered overbought. When its below 0.2, the asset may be considered oversold. However, its worth mentioning that these shouldnt be viewed as direct signals to enter or exit trades. While this information is certainly telling a story, there may be other sides to the story as well. This is why most technical analysis tools are best used in combination with other market analysis techniques.
What are Bollinger Bands (BB)?
Named after John Bollinger, the Bollinger Bands measure market volatility, and are often used to spot overbought and oversold conditions. This indicator is made up of three lines, or bands an SMA (the middle band), and an upper and lower band. These bands are then placed on a chart, along with the price action. The idea is that as volatility increases or decreases, the distance between these bands will change, expanding and contracting..

Bollinger Bands on a Bitcoin chart.
Lets go through the general interpretation of Bollinger Bands. The closer the price is to the upper band, the closer the asset may be to overbought conditions. Similarly, the closer it is to the lower band, the closer the asset may be to oversold conditions.
One thing to note is that the price will generally be contained within the range of the bands, but it may break above or below them at times. Does this mean that its an immediate signal to buy or sell? No. It just tells us that the market is moving away from the middle band SMA, reaching extreme conditions.
Traders may also use Bollinger Bands to try and predict a market squeeze, also known as the Bollinger Bands Squeeze. This refers to a period of low volatility when the bands come really close to each other and squeeze the price into a small range. As the pressure builds up in that small range, the market eventually pops out of it, leading to a period of increased volatility. Since the market can move up or down, the squeeze strategy is considered neutral (neither bearish or bullish). So it might be worth combining it with other trading tools, such as support and resistance.
What is the Volume-Weighted Average Price (VWAP)?
As weve discussed earlier, many traders consider the trading volume to be the most important indicator out there. So, are there any indicators based on volume?
The volume-weighted average price, or VWAP, combines the power of volume with price action. In more practical terms, its the average price of an asset for a given period weighted by volume. This makes it more useful than simply calculating the average price, as it also takes into account which price levels had the most trading volume.
How do traders use the VWAP? Well, the VWAP is typically used as a benchmark for the current outlook on the market. In this sense, when the market is above the VWAP line, it may be considered bullish. At the same time, if the market is below the VWAP line, it may be considered bearish. Have you noticed how this is similar to the interpretation of moving averages? The VWAP may indeed be compared to moving averages, at least in the way its used. As weve seen, the main difference is that the VWAP considers the trading volume as well.
In addition, the VWAP can also be used to identify areas of higher liquidity. Many traders will use the price breaking above or below the VWAP line as a trade signal. However, they will typically also incorporate other metrics into their strategy to reduce risks.
What is the Parabolic SAR?
The Parabolic SAR is used to determine the direction of the trend and potential reversals. SAR stands for Stop and Reverse. This refers to the point where a long position should be closed and a short position opened, or vice versa.
The Parabolic SAR appears as a series of dots on a chart, either above or below the price. Generally, if the dots are below the price, it means the price is in an uptrend. In contrast, if the dots are above the price, it means the price is in a downtrend. A reversal occurs when the dots flip to the other side of the price.

The Parabolic SAR on a Bitcoin chart.
The Parabolic SAR can provide insights into the direction of the market trend. Its also handy for identifying points of trend reversal. Some traders may also use the Parabolic SAR indicator as a basis for their trailing stop-loss. This special order type moves along with the market and makes sure that investors can protect their profits during a strong uptrend.
What is the Ichimoku Cloud?
The Ichimoku Cloud is a TA indicator that combines many indicators in a single chart. Among the indicators weve discussed, the Ichimoku is certainly one of the most complicated. At first glance, it may be hard to understand its formulas and working mechanisms. But in practice, the Ichimoku Cloud is not as hard to use as it seems, and many traders use it because it can produce very distinct, well-defined trading signals.
As mentioned, the Ichimoku Cloud isnt just an indicator, its a collection of indicators. Its a collection that provides insights into market momentum, support and resistance levels, and the direction of the trend. It achieves this by calculating five averages and plotting them on a chart. It also produces a cloud from these averages which may forecast potential support and resistance areas.
While the averages play an important role, the cloud itself is a key part of the indicator. Generally, if the price is above the cloud, the market may be considered to be in an uptrend. Conversely, if the price is below the cloud, it may be considered to be in a downtrend.

The Ichimoku Cloud on a Bitcoin chart, acting as support, then resistance.
The Ichimoku Cloud may also strengthen other trading signals.
Chapter 6 Cryptocurrency Trading Tips
Contents
- How do I start trading cryptocurrency?
- How to trade cryptocurrency on Binance
- What is a trading journal, and should I use one?
- How should I calculate my position size in trading?
- What online trading software should I use?
- Should I join a paid group for trading?
- What is a pump and dump (PD)?
- Should I sign up for cryptocurrency airdrops?
How do I start trading cryptocurrency?
If you’ve decided you’d like to start trading, here are a few things to consider.
Firstly, you’ll, of course, need capital to trade with. If you dont have savings and start trading with money you cant lose, it can have a seriously detrimental impact on your life. Trading isn’t an easy feat an overwhelming majority of beginner traders lose money. You’ll need to expect that the money you put aside for trading can vanish quickly, and you may never recover your losses. This is why its recommended to start with smaller amounts to test out the waters.
Something else youll also need to think about is your overall trading strategy. There are a lot of possible avenues to take when it comes to making money in the financial markets. Depending on the time and effort you can put into this undertaking, you can choose between many different strategies to achieve your financial goals.
Lastly, heres an additional point. Many traders are at their best when trading isnt their main source of income. This way, the emotional burden is easier to bear than if their day-to-day survival depended on it. Eliminating emotion is a core trait of successful traders, and its significantly harder to do when ones livelihood is at stake. So, especially when youre starting out, you could think of trading and investing as a side venture. And remember to start with small amounts for the sake of learning and practicing. It may also be beneficial to look into ways of making passive income with cryptocurrency.
How to trade cryptocurrency on Binance
So, you’ve decided you want to get into the world of trading cryptocurrency. What do you need to do?
First, you need to convert your fiat currency into cryptocurrency. The easiest way to do that is by going to the Buy Crypto page on Binance, where youll have a plethora of options. You can buy crypto with debit and credit cards, using your bank account on the P2P exchange, and through third-party solutions like Simplex, Paxful, or Koinax. Once you’re done, youll be part of the new financial system!
Now that you’ve got your cryptocurrency, the potential options are abundant. Right away, you can go to the Binance spot exchange and trade coins. If you have previous experience with trading, you could also check out the Binance margin trading platform or Binance Futures. There are also passive income opportunities available, which include staking, lending your assets in Binance Savings, joining the Binance mining pool, and more.
So far, these all included what is called a centralized exchange like Binance. These are exchanges where you deposit your crypto and do your financial activities within the exchanges internal systems. However, thanks to the magic of blockchain technology, there are other options out there called decentralized exchanges (DEX). On these venues, your funds never leave your own cryptocurrency wallet, so youll have full custody of them at all times. You can also connect your hardware wallet and trade directly from it.
What is a trading journal, and should I use one?
A trading journal is a documentation of your trading activities. Should you keep one? Probably! You could use a simple Excel spreadsheet, or subscribe to a dedicated service.
Especially when it comes to more active trading, some traders consider keeping a trading journal essential to becoming consistently profitable. After all, if you dont document your trading activities, how will you identify your strengths and weaknesses? Without a trading journal, you wouldnt have a clear idea of your performance.
Bear in mind that biases can play a major part in your trading decisions, and a trading journal can help mitigate some of them. How? Well, you cant argue with the data! Trading performance all comes down to numbers, and if youre not doing something well, that will be reflected in your performance. By meticulously keeping a trading journal, you can also monitor what strategies perform best.
How should I calculate my position size in trading?
One of the most important aspects of trading is risk management. In fact, some traders argue it is the most important thing. This is why it’s critical to calculate the size of your positions with a standardized formula. Heres how the calculation goes.
First, you need to determine how much of your account you are willing to risk on individual trades. Lets say this is 1%. Does it mean you enter positions with 1% of your account? No, it means that if your stop-loss is hit, you wont lose more than 1% of your account.
That may seem too little, but this is to make sure that a few inevitable bad trades wont blow up your account. So, once youve got this defined, you need to determine where your stop-loss is. You do this for each individual trade, based on the specifics of the trade idea. Let’s say youve determined that youre going to place your stop-loss 5% from your initial entry. This means that when your stop-loss is hit, and you exit 5% from your entry, you should lose exactly 1% of your account.
So, lets say our account size is 1000 USDT. Were risking 1% with each trade. Our stop-loss is 5% from our entry. What position size should we use?
1000*0.01/0.05=200
If we want to only lose 10 USDT, which is 1% of our account, we should enter a 200 USDT position.
This process can seem a bit lengthy at first, but its essential for managing risk properly. Good news, weve got an entire article about it: How to Calculate Position Size in Trading.
What online trading software should I use?
Chart analysis is a core part of any technical analysts trading toolkit. But where is the best way to do it? Binance has integrated TradingView charts, so you can do your analysis directly on the platform both on the web interface and in the mobile app. You can also create a TradingView account and check all Binance markets through their platform.
There are numerous other online charting software providers in the market, each providing different benefits. Typically, though, youll have to pay a monthly subscription fee. Some other ones focused on crypto trading are Coinigy, TradingLite, Exocharts, and Tensorcharts.
Should I join a paid group for trading?
Most likely not. Great free information about trading is abundant out there, so why not learn from that? It’s also useful to practice trading on your own, so you can learn from your mistakes and find what works best for you and your trading style.
Entering a paid group can be a valid learning tool, but beware of scams and fake advertising. After all, its quite easy to fake trading results to gain followers for a paid service.
It’s also worth thinking about why a successful trader might want to start a paid group in the first place. Sure, a bit of side income is always welcome, but why do it for a hefty fee if they are doing so well already?
With that said, some successful traders run high-quality paid communities with additional services such as special market data. Just be extra careful who you give your money to, as the majority of paid groups for trading exist to take advantage of beginner traders.
What is a pump and dump (PD)?
A pump and dump is a scheme that involves boosting the price of an asset through false information. When the price has gone up a significant amount (pumped), the perpetrators sell (dump) their cheaply bought bags at a much higher price.

Typical price pattern of a pump and dump scheme.
Pump and dump schemes are rampant in the cryptocurrency markets, especially in bull markets. During these times, many inexperienced investors enter the market, and they are easier to take advantage of. This type of fraud is most common with small market cap cryptocurrencies, as their prices are generally easier to inflate due to the low liquidity of these markets.
Pump and dump schemes are often orchestrated by private pump and dump groups that promise easy returns for joiners (usually in exchange for a fee). However, what usually happens is that those joiners are taken advantage of by an even smaller group who have already built their positions.
In the legacy markets, people found guilty of facilitating pump and dump schemes are subject to hefty fines.
Should I sign up for cryptocurrency airdrops?
Maybe, but be extra careful! Airdrops are a novel way of distributing cryptocurrencies to a wide audience. An airdrop can be a great way to make sure that a cryptocurrency isnt centralized in the hands of only a few holders. A diverse set of holders is paramount for a healthy, decentralized network.
However, theres no such thing as a free lunch. Well, sometimes, there may be, if you get very lucky! Typically, though, what happens is that the promoters of the airdrop will outright try to take advantage of you, or will want something in return.
What will they ask for? One of the most common assets asked in return for an airdrop is your personal information. Is your personal data worth $10-50 worth of a highly speculative cryptocurrency? Thats your choice to make, but there may be better ways to earn a bit of side income, without putting your privacy and personal data at risk. This is why you need to be extra careful when thinking about signing up for cryptocurrency airdrops.
Closing thoughts
So, we went through a lot, haven’t we? Getting started with cryptocurrency trading can be a daunting task there are so many concepts to learn. Hopefully, this guide has helped you feel a bit more comfortable with cryptocurrency trading.
However, there is always more to learn! This is why we’ve created a discord server If you have any further questions about cryptocurrency trading, blockchain technology, cryptography, or other related topics, feel free to join and ask See you there.


